
What you'll build
Links to a live demo and the final code below. This workshop should take around 1 hour.
Warning: the following demo involves flashing colors and is not recommended for those with a history of epilepsy. There's also an animated demo.
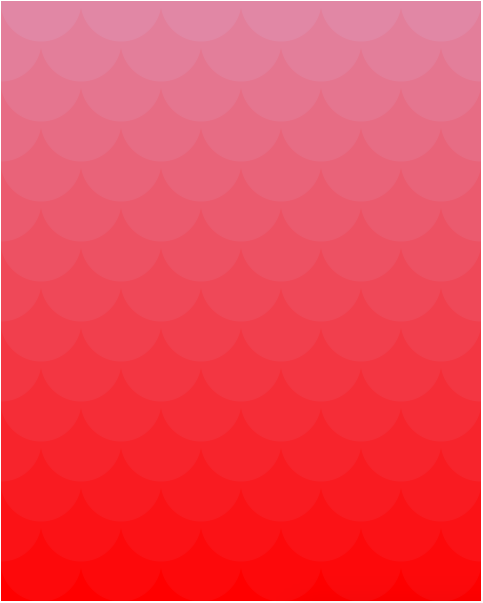
We'll be creating a cool graphic like the one above, using JavaScript and p5.js. p5.js is a library for making stuff in conjunction with the HTML canvas element. p5.js is nothing more than JavaScript code written to make commonly-desired functionality much more accessible. It is primarily used to make visuals and graphics for games and websites.
Part I: Set-up
First, go to Repl.it and spin up a new HTML repl
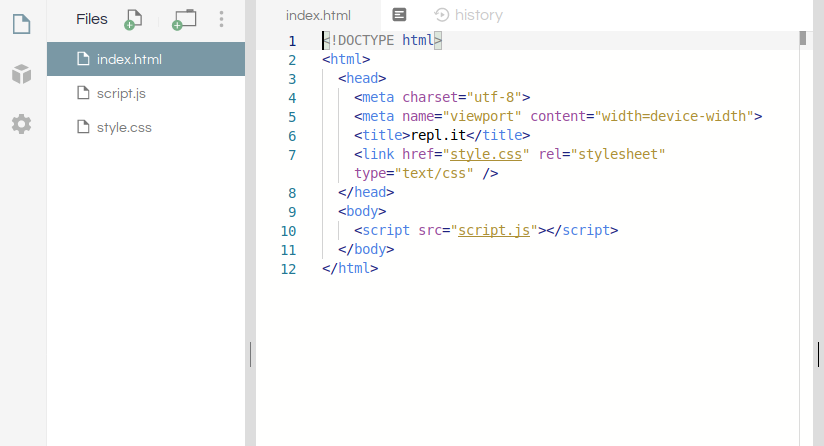
From here, clear the contents of index.html and put the following in its place
<!DOCTYPE html>
<html>
  <head></head>
  <body></body>
</html>
Now, let's add our JavaScript dependencies, namely, p5.js. Let's add that into our body with a <script> tag:
<body>
  <script src="https://cdn.jsdelivr.net/npm/p5@1.0.0/lib/p5.js"></script>
</body>
We'll also need to attach our JavaScript file, script.js. Add this below the line that adds p5.js:
<body>
  <script src="https://cdn.jsdelivr.net/npm/p5@1.0.0/lib/p5.js"></script>
  <script src="script.js"></script>
</body>
Go ahead and Run the project (or the shortcut Ctrl+Enter / Command+Enter). All we have right now is a blank screen but we'll start adding content next.
Priming the JS File
Double-click script.js to open, and type the following:
function setup() {}

function draw() {}
p5.js works by automatically calling two special functions: setup() and draw() to create the visuals on your webpage. We'll be writing our own code in these functions, so that p5.js can then run our code.
setup() is run only once, at the beginning. draw() on the other hand, is run repeatedly after setup() finishes, and in this way, provides the basis for any animation or interaction you see in your project.
Let's save and refresh Live Preview.
It looks like nothing, because our functions do nothing. Let's add something for setup() to set up.
function setup() {
  createCanvas(480, 600)
}
createCanvas() is a function that takes two arguments (two numbers for width and height, respectively) and creates an HTML canvas element (i.e., where your pattern will be contained) of that size.
In this project, we'll be creating a tiling of overlapping circles.
First, let's decide how many circles we want in each row. We can store this number in a variable at the top, above both functions:
var NUM_CIRCLES = 12

function setup() {
  createCanvas(480, 600)
}

function draw() {}
We'll use this to determine the diameter of the circles we want to draw, by doing some simple math. Let's declare a variable to store the value of the circle diameter; name it circleDiameter. Add the declaration at the top of the file, underneath NUM_CIRCLES, and define it within setup():
var NUM_CIRCLES = 12
var circleDiameter

function setup() {
  createCanvas(480, 600)
  circleDiameter = width / NUM_CIRCLES
}

function draw() {}
p5.js stores the width of the canvas in a variable named width. By dividing the width by the number of circles, we can calculate the length of the diameter, which we'll store in circleDiameter.
Part II: Drawing on the Canvas
Drawing One Circle
p5.js makes drawing circles easy with the function circle().
Let's see the circle() function in action by drawing a circle in the middle of the screen:
function draw() {
  circle(width / 2, height / 2, circleDiameter)
}
Run to see the updated website. It might also be helpful to open up the external preview:
In this example, the first two arguments we pass to the circle function are the x and y coordinates of the center of the circle. We've passed in width/2 and height/2, respectively, which means the center of the circle will also be the center of the canvas. The last argument is the diameter of the circle. Since we want to draw a circle, we're passing the same value for both.
You can play around with these values to get a better feel of how this function works.
Drawing a Row of Circles
Let's try to draw a row of circles first. We'll want to place them circleDiameter away from each other. Modify your draw() function so it looks like this. Notice how we have to change the first argument (the x-coordinate) in each line.
function draw() {
  circle(0, height / 2, circleDiameter)
  circle(circleDiameter, height / 2, circleDiameter)
  circle(2 * circleDiameter, height / 2, circleDiameter)
  circle(3 * circleDiameter, height / 2, circleDiameter)
  circle(4 * circleDiameter, height / 2, circleDiameter)
}
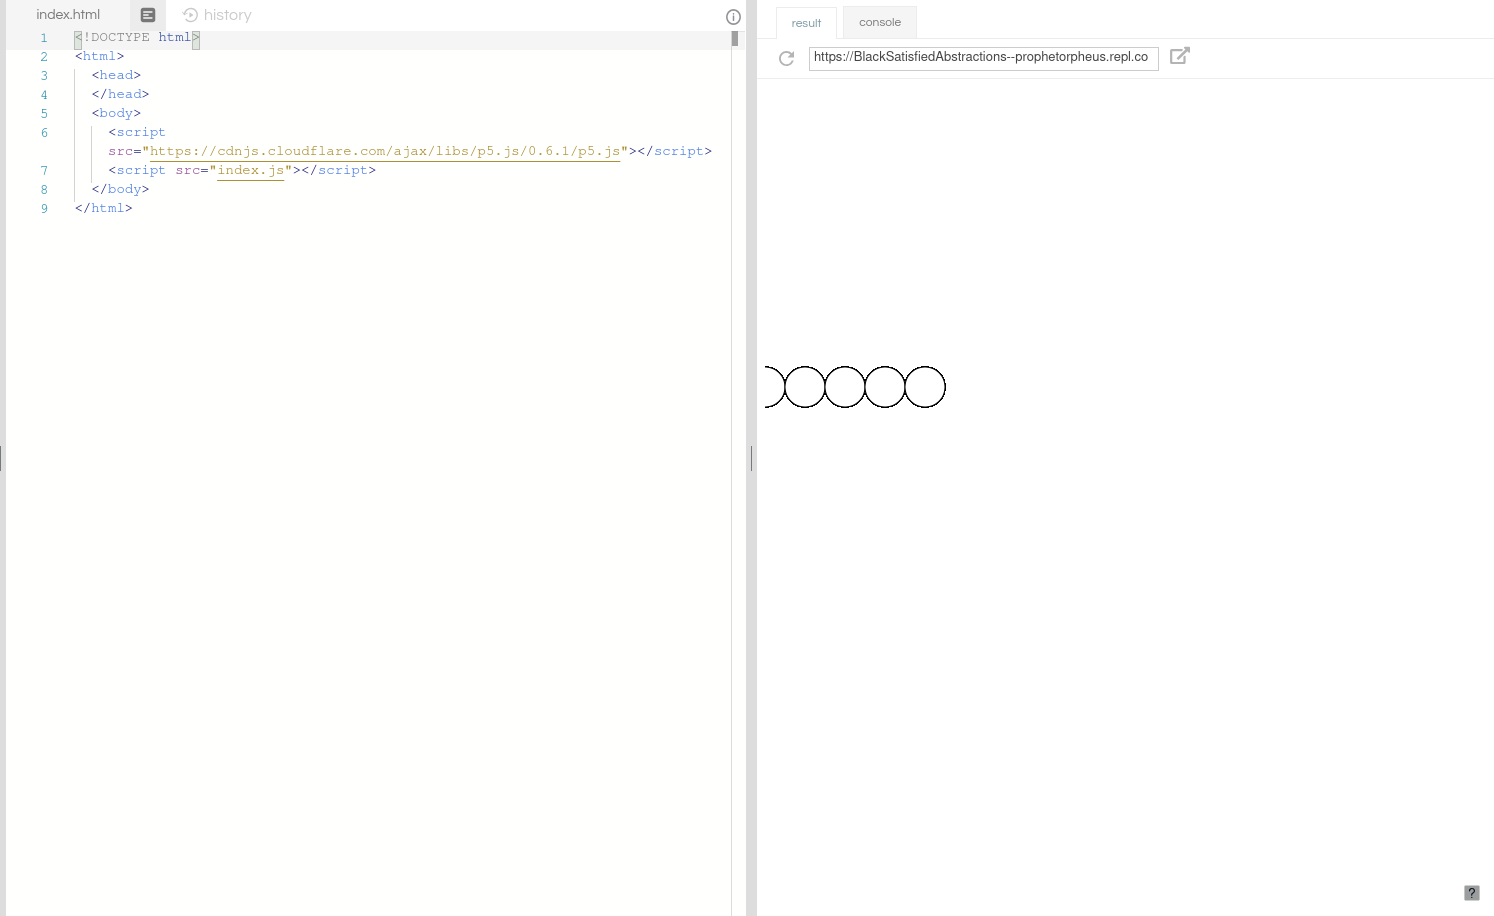
So here we've drawn 4.5 circles. Why is there a half-circle? Check out the documentation for circle() and see if you can figure it out.
Anyway, we can draw 7.5 more, since we've made room for 12 (when we set NUM_CIRCLES). Keep going until it looks like this:
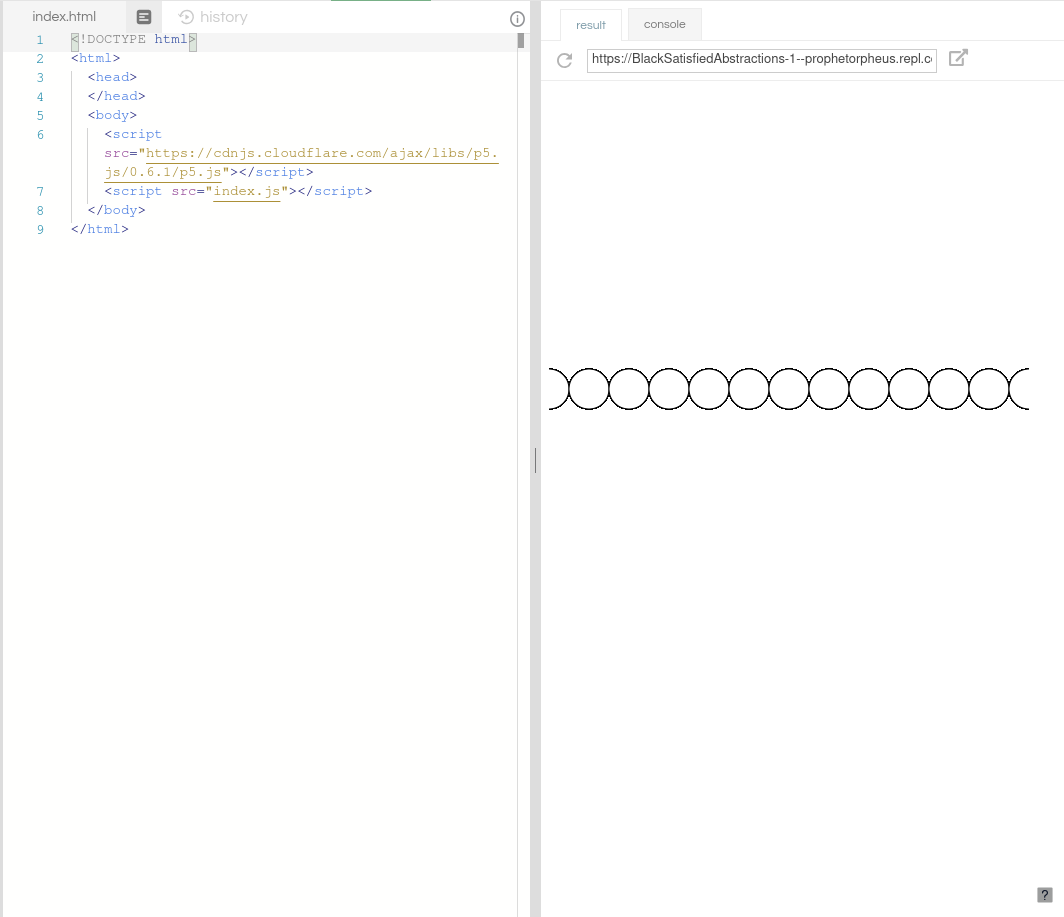
Great, now that we've drawn one row of circles in the middle, we have to draw the other rows. Guess we'll be writing a lot of circle() statements.
Just kidding! There's a construct in programming called a loop, and it repeats a set of instructions as many times as you decide.
Here's a quick example loop.
Let's remove all those repetitive lines and add a loop into our draw() function. We'll be using a type of loop called a while-loop, like so:
function draw() {
  var x = 0
  while (x <= width) {
    x = x + circleDiameter
  }
}
You'll notice there are multiple parts to this:
var x = 0;: this is a variable that will store the value of our x-coordinate as we draw circles across the row.while (x <= width): this is the header of the while-loop, and it means that the instructions within the loop should be executed as long asxis less than or equal towidth.{and the corresponding}at the bottom: these braces enclose the code that should be repeated.x = x + circleDiameter;: this is one instruction we want to be repeated. This will alter the value ofx, incrementing it bycircleDiameterevery time we go through the loop.
If we save and refresh, we'll see nothing. That's because there is no code inside the while-loop that affects the canvas. Let's add a line to draw a circle at the top of the canvas:
function draw() {
  var x = 0
  while (x <= width) {
    circle(x, 0, circleDiameter)
    x = x + circleDiameter
  }
}
We're supplying x as the x-coordinate (cleverly named, eh?), and 0 as the y-coordinate, of the circle's center.
If you save and refresh, you'll see a line of cut-off circles at the top. Since the value of x is increased by circleDiameter after every iteration of the while-loop, circles are drawn in intervals of circleDiameter pixels, just like how you changed the x-coordinate argument in circle() when you were manually creating each circle. This is the magic of the while-loop.
As to why the circles are cut off -- this is because we set the y-coordinate of the center of every circle to 0.
Remark: if your page is frozen, refresh the page and check your while-loop code. Chances are you've got an infinite loop.
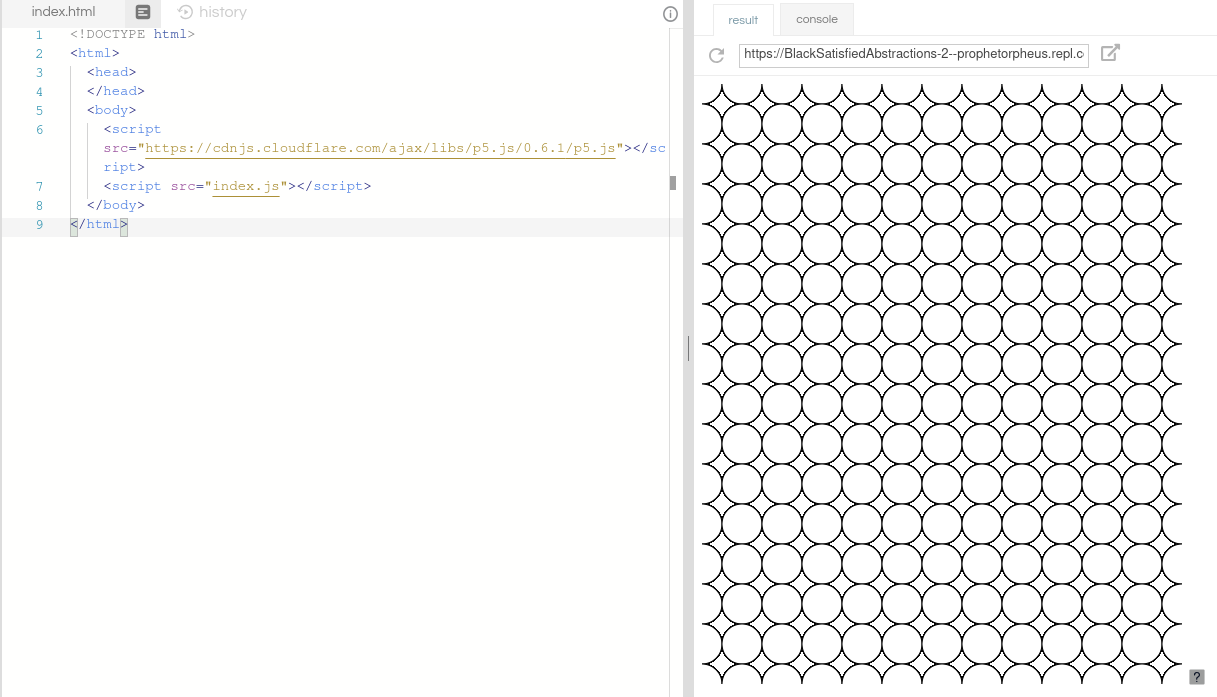
Drawing a Grid of Circles
So that's great, we've drawn one row of circles. But what we'd like is to cover the entire canvas with circles.
Just like we used a loop to repeat circles in the horizontal direction, we can also use another loop to repeat them in the vertical direction.
If we wrap our existing while-loop in another while-loop, we'll be performing the action of filling an entire row with circles, multiple times. And thus covering multiple rows.
Let's put everything so far inside another while-loop. Don't forget to update circle():
function draw() {
  var y = 0
  while (y <= height) {
    var x = 0
    while (x <= width) {
      circle(x, y, circleDiameter)
      x = x + circleDiameter
    }

    y = y + circleDiameter
  }
}
As with the previous while-loop's x, we're executing the code inside the { and } as long as the value of y, which we've initialized at 0, is less than or equal to height. (height, as you may have guessed, is the counterpart to width, and it is where p5.js stores the height of the canvas.) We're also incrementing y at the end of each iteration by circleDiameter.
Using this incrementing y variable as our y-coordinate is how we're able to draw rows up and down the canvas.
Go ahead and Run your repl to see your updated website!
Offsetting the Circles in the Y-Direction
We want the circles to overlap, so let's change the spacing in the y-direction.
We can achieve this by changing the last line of the y while-loop to increment by circleDiameter/2 instead of circleDiameter.
We'll create a variable (call it circleRadius) for this, at the top of the file, define it in setup(), and make the replacement in the last line of the y while-loop:
var NUM_CIRCLES = 12
var circleDiameter
var circleRadius

function setup() {
  createCanvas(480, 600)
  circleDiameter = width / NUM_CIRCLES
  circleRadius = circleDiameter / 2
}

function draw() {
  var y = 0
  while (y <= height) {
    var x = 0
    while (x <= width) {
      circle(x, y, circleDiameter)
      x = x + circleDiameter
    }

    y = y + circleRadius
  }
}
Save and refresh Live Preview to see the change.
Offsetting the Circles in the X-Direction
It looks pretty cool right now, but our circles aren't overlapping exactly right. It looks like every other row should be shifted horizontally by circleRadius.
We can keep track of shifted rows by using a flag. A flag is just a variable that stores a true/false value.
Let's add one in our draw() function:
function draw() {
  var isShifted = false

  var y = 0
  while (y <= height) {
    var x = 0
    while (x <= width) {
      circle(x, y, circleDiameter)
      x = x + circleDiameter
    }

    y = y + circleRadius
  }
}
To differentiate between rows, we should add a line to flip the flag at the bottom of the y while-loop, underneath the line that flips isShifted. This is because each pass through the y while-loop creates a new row, thus it would be appropriate after the creation of each row to flip the flag.
We'll using the negation operator (!) to flip from false to true and vice versa:
function draw() {
  var isShifted = false

  var y = 0
  while (y <= height) {
    var x = 0
    while (x <= width) {
      circle(x, y, circleDiameter)
      x = x + circleDiameter
    }

    y = y + circleRadius
    isShifted = !isShifted
  }
}
This sets the flag isShifted to its opposite. Its initial value was false, and after one row, its value will be true. Thus, the second row will be an shifted row. After the second row is created, the flag will be flipped back to false, and so on.
Let's create a conditional that will use the flag's value to determine whether or not to shift the row. We'll add this just after we define x, inside the y while-loop:
function draw() {
  var isShifted = false

  var y = 0
  while (y <= height) {
    var x = 0

    if (isShifted) {
    } else {
    }

    while (x <= width) {
      circle(x, y, circleDiameter)
      x = x + circleDiameter
    }

    y = y + circleRadius
    isShifted = !isShifted
  }
}
Now we just need to make this shift. We'll do this by modifying the starting x value. Currently, the starting x value is always 0, which results in every row starting at the x-coordinate 0.
We can modify this by removing this definition:
- var x = 0;
+ var x;
And setting the value conditionally:
while (y <= height) {
  var x

  if (isShifted) {
    x = circleRadius
  } else {
    x = 0
  }

  while (x <= width) {
    // ...
  }
}
Your draw() should now look like this:
function draw() {
  var isShifted = false

  var y = 0
  while (y <= height) {
    var x

    if (isShifted) {
      x = circleRadius
    } else {
      x = 0
    }

    while (x <= width) {
      circle(x, y, circleDiameter)
      x = x + circleDiameter
    }

    y = y + circleRadius
    isShifted = !isShifted
  }
}
Save and check it out!
Be sure to Run your code to see your updated website!
Reversing Direction
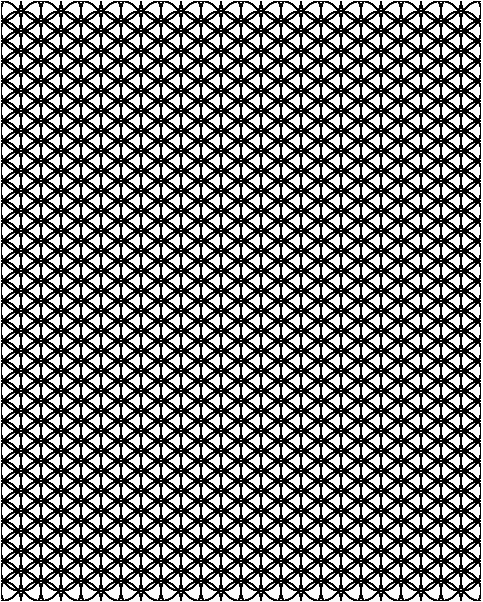
So you may have noticed that it seems that our circles are overlapping on the wrong side. We wanted them to overlap each other on the top, but they are overlapping on the bottom. This is because they are being drawn from top to bottom, and the upper circles are being drawn over.
We can fix this by setting the initial value of y to the height, and changing the condition in the while-loop to check if y is greater than 0. We'll also decrement the value of y instead of incrementing it, at the bottom of the y while-loop;
function draw() {
  var isShifted = false

  var y = height
  while (y >= 0) {
    var x

    if (isShifted) {
      x = circleRadius
    } else {
      x = 0
    }

    while (x <= width) {
      circle(x, y, circleDiameter)
      x = x + circleDiameter
    }

    y = y - circleRadius
    isShifted = !isShifted
  }
}
If your page has frozen, you've probably introduced an infinite loop. Refresh your Cloud 9 workspace and check your code!
Save to see the changes!
Run your repl once again now that we've done some more work.
Part III: Adding Color
Black and white is nice, but how about some color? We've previously used CSS to change colors, but this is a special case -- CSS can't modify anything inside of a canvas (the container all our p5 stuff shows up in).
p5.js provides several helpful functions, including: color(), fill(), and stroke() that help modify graphics inside a canvas.
Changing Fill
One way to use color() is to provide 3 arguments; each corresponding to red (R), green (G), and blue (B) values.
Let's choose our color to be red. The R, G, and B values for a bright red are 255, 0, and 0, respectively. We can create this color with color(255, 0, 0).
Now we'll pass this color to the fill() function. If we do this before drawing the circle, all the circles we draw will be filled with that color. Let's give this a try and type the following line immediately before calling the circle() function in draw():
fill(color(255, 0, 0))
Save and refresh. Your canvas should now look like red dragon scales.
Changing Stroke
Just like how there's a fill() for changing the fill color, there's a stroke() for changing the stroke color. Right now, the stroke is black (hence the black outlines).
We can make a garish display by adding a bright green stroke, if we place the following line beneath our fill() function call:
stroke(color(0, 255, 0))
Save and refresh, and let your eyes be assaulted by this faux pas.
Changing Color between Rows
While this looks pretty cool, let's make the rows different colors. We can get the gradient effect by setting a starting color, and incrementing the R, G, and B values each time we go through the for loop.
Let's do this by first declaring variables to store each of the R, G, and B values at the top of the file:
var NUM_CIRCLES = 12
var circleDiameter
var circleRadius
var rVal
var gVal
var bVal
Next, we'll set their initial values at the top of the draw() function:
function draw() {
  rVal = 255
  gVal = 0
  bVal = 0

  var isShifted = false

  // ...the rest of the draw function
}
And then increment the values at the bottom of the y while-loop in draw(), by adding these lines.
y = y - circleRadius
isShifted = !isShifted

rVal = rVal - 2
gVal = gVal + 7
bVal = bVal + 3
Here, we're decrementing the R value by 2, incrementing the G value by 7, and the B value by 3.
You can also try adding those three lines within the x while-loop, which will modify the colors within each row.
Finally, we'll replace the arguments in color() with these variables, in both the fill() and stroke() function calls:
fill(color(rVal, gVal, bVal))
stroke(color(rVal, gVal, bVal))
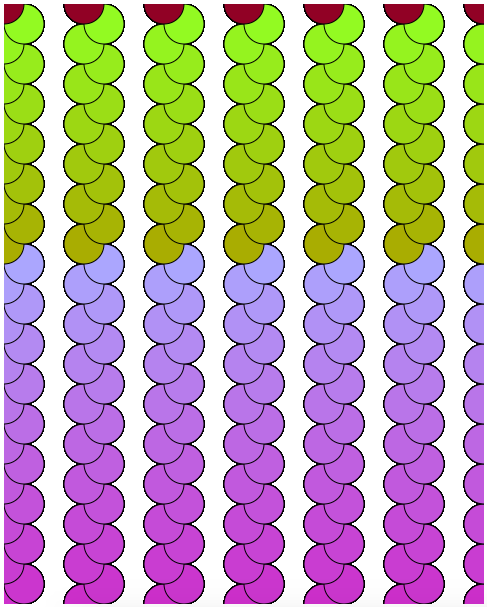
Now, save and see the gradient effect you've applied throughout the pattern! Yay!
We've got another feature done, so let's Run again
Part IV: Publishing and Sharing
Downloading Your Masterpiece
You can actually download the this cool pattern to your computer, to use as a desktop background or what have you. p5.js provides a function saveCanvas() to download the canvas.
We can attach this function to a key press by using p5's keyPressed function. Add this at the bottom of your script.js:
function keyPressed() {
  if (keyCode === 115 || keyCode === 83) {
    saveCanvas('geometricPattern', 'png')
  }
  return false
}
This code says that if the user presses a key with the keyCode 115 or 83 (which both correspond to "s"), saveCanvas() should be called and the file should be saved as geometricPattern.png.
The return false; at the end of the function tells the browser to ignore any default behavior that might be associated with the pressed key (ex. if you press enter, the browser thinks that you're trying to submit a form by default -- this prevents that).
Now let's Run the repl once again
Making It Live
Congratulations! Your website is live at your URL and is looking dang fantastic!
Part V: Animate It
WARNING: THIS SECTION INVOLVES FLASHING COLORS AND IS NOT RECOMMENDED FOR THOSE WITH A HISTORY OF EPILEPSY.
Even if you have not been previously diagnosed with epilepsy, you should be careful, and immediately close the window and consult a doctor if you experience any of the following symptoms: lightheadedness, altered vision, eye or face twitching, jerking or shaking of arms or legs, disorientation, confusion, or momentary loss of awareness.
Let's first add the line to change the draw() function from running 60 times a second to 5 times a second. We can do this by using the frameRate() function in setup():
function setup() {
  createCanvas(480, 600)

  frameRate(5)

  circleDiameter = width / NUM_CIRCLES
  circleRadius = circleDiameter / 2
}
That said, we can create a cool scrolling color effect by manipulating our colors to cycle. Right now we are resetting our initial RGB values each time draw() runs. But if we didn't reset every time, we could have rotating colors.
function setup() {
  createCanvas(480, 600)

  frameRate(5)

  circleDiameter = width / NUM_CIRCLES
  circleRadius = circleDiameter / 2

  rVal = 255
  gVal = 0
  bVal = 0
}

function draw() {
  var isShifted = false

  // ...the rest of the draw function
}
If we move the three lines that set the initial RGB values to setup(), then we will be increment the values indefinitely. If we save and refresh our Live Preview, we'll see that everything is white. What's the deal?
Since the max values of RGB are 255, 255, 255 (which makes white), any values above that will be white. The draw() function executes so many times per second that you can't see the color change progression.
We can have color progression while keeping the values below 255 by modding each of these by 256. "Modding a by b" means that we divide a by b, and take the remainder. For example, 5mod2 gives us 1, because 5 divided by 2 has a remainder of 1. This arithmetic operation is available to us in JavaScript with the modulo (%) operator.
Let's change our incrementation code to incorporate this:
rVal = (rVal - 2) % 256
gVal = (gVal + 7) % 256
bVal = (bVal + 3) % 256
JavaScript % operator does something stupid, in that it mods negative numbers incorrectly. We can get around this by recognizing that subtracting 2 and modding is the same as adding 254 and modding.
rVal = (rVal + 254) % 256
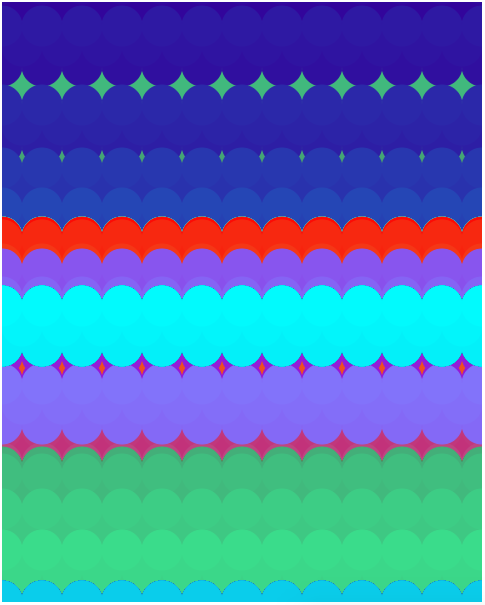
Save and refresh and be warned that it might be jarring.
As a check, your script.js should look like this:
Final code:
var NUM_CIRCLES = 12

var circleDiameter
var circleRadius

var rVal
var gVal
var bVal

function setup() {
  createCanvas(480, 600)

  frameRate(5)

  circleDiameter = width / NUM_CIRCLES
  circleRadius = circleDiameter / 2

  rVal = 255
  gVal = 0
  bVal = 0
}

function draw() {
  var isShifted = false

  var y = height
  while (y >= 0) {
    var x

    if (isShifted) {
      x = circleRadius
    } else {
      x = 0
    }

    while (x <= width) {
      stroke(color(rVal, gVal, bVal))
      fill(color(rVal, gVal, bVal))
      circle(x, y, circleDiameter)
      x = x + circleDiameter
    }

    y = y - circleRadius
    isShifted = !isShifted

    rVal = (rVal + 254) % 256
    gVal = (gVal + 7) % 256
    bVal = (bVal + 3) % 256
  }
}
Part VI: Hacking
Ideas:
- try different colors until you find a combination you like (you can do this by changing the start values of
rVal,gVal, andbVal. You can also change the incrementing value) - try no fill to make cool line art with overlapping circles
- change number of circles per line
- change number of lines / spacing of lines
- change shape of circles (what about horizontally fat ovals? vertically tall ovals?)
- change placement or spacing of circles
- change shapes (p5.js offers easy functions to make triangles, rectangles, and more)
- p5.js knows where your mouse x and y coordinates are. You could have the seizure-inducing colors only on mouse over.
Examples: