

Join Hack Club Horizons! Ship your projects and fly to your first hackathon →
In this workshop, you'll build a weather grapher program which will be able to graph the average temeprature in any city for a given time range that the user inputs. We'll be using the Chart.js library to graph the data and the Meteostat Web API to let us get weather data. This workshop should take around 20-30 minutes to complete.
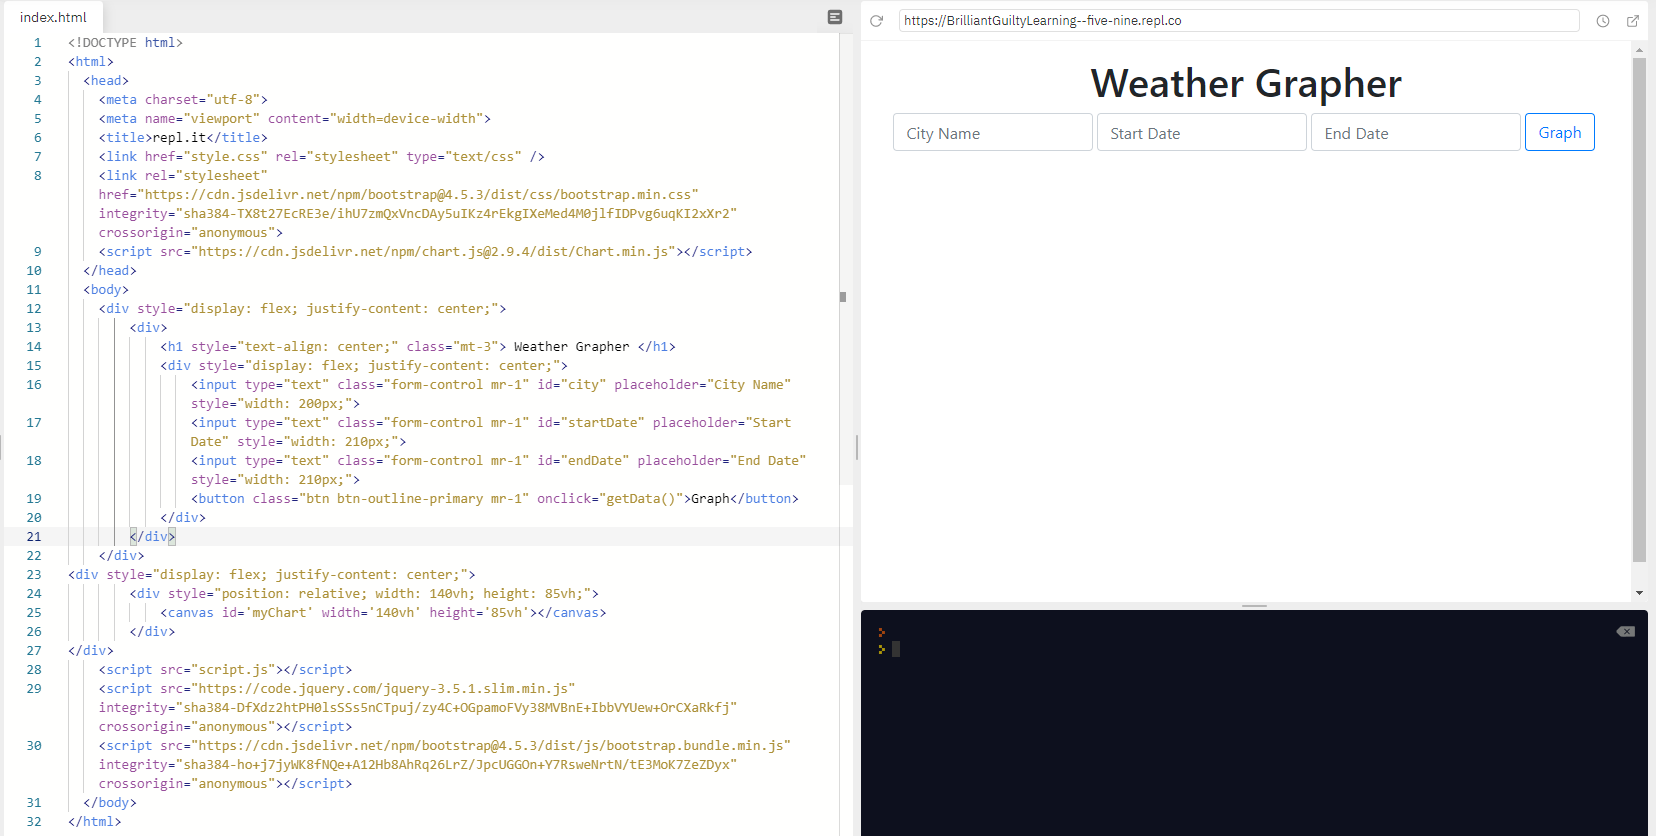
This is what you'll build by the end of this workshop:
Live Demo with Code: Repl
Final Product (without code): Live
Prerequisites
To complete this workshop you should have a basic understanding of the fundamentals of:
- HTML
- CSS
- JavaScript (DOM, loops, arrays, objects, functions, and conditionals)
You do NOT need any prior understanding of:
- Web APIs
- How to make API calls with
fetch() - Chart.js Library
If any of these concepts don't sound familiar to you, don't worry! We'll be learning them as we go.
Let's begin!
Getting started
We'll be using repl.it to make this project. Head on over to https://repl.it/languages/HTML to start coding. It's suggested that you make an account so you don't lose your code.
Loading Bootstrap and Chart.js
We'll be using Bootstrap to quickly style our interface and give it a clean look. We're simply using a CDN, a content delivery network, to load Bootstrap and the Chart.js library so we can use it later. What's a CDN?
Start by copying the following lines of code between the <head></head> tags of your index.html file:
    <link rel="stylesheet" href="https://cdn.jsdelivr.net/npm/bootstrap@4.5.3/dist/css/bootstrap.min.css" integrity="sha384-TX8t27EcRE3e/ihU7zmQxVncDAy5uIKz4rEkgIXeMed4M0jlfIDPvg6uqKI2xXr2" crossorigin="anonymous">
    <script src="https://cdn.jsdelivr.net/npm/chart.js@2.9.4/dist/Chart.min.js"></script>
Next, add these two <script> tags. These are simply some JavaScript libraries that Bootstrap requires to function.
    <script src="https://code.jquery.com/jquery-3.5.1.slim.min.js" integrity="sha384-DfXdz2htPH0lsSSs5nCTpuj/zy4C+OGpamoFVy38MVBnE+IbbVYUew+OrCXaRkfj" crossorigin="anonymous"></script>
    <script src="https://cdn.jsdelivr.net/npm/bootstrap@4.5.3/dist/js/bootstrap.bundle.min.js" integrity="sha384-ho+j7jyWK8fNQe+A12Hb8AhRq26LrZ/JpcUGGOn+Y7RsweNrtN/tE3MoK7ZeZDyx" crossorigin="anonymous"></script>
If you want to read about everything that Bootstrap has to offer, the documentation is the best place to start.
Building the User Interface
Inside of the <body> tag, add a <h1> tag with property style="text-align:center;" that displays "Weather Grapher" with class="mt-3". This class adds a slight margin to the top so it doesn't look too cramped on the screen.
Add a <div> after the header with the styling style="display: flex; justify-content: center;", which centers it horizontally on the screen. This <div> will hold the input fields for the city, start date, and end date. Inside this <div> add an <input> with the following properties: type="text" class="form-control mr-1" id="city" placeholder="City Name" style="width; 200px". Repeat this type of <input> two more times, except replacing the id and placeholder attributes with "Start Date" and "End Date" respectively.
<body>
  <h1 style="text-align: center;" class="mt-3"> Weather Grapher </h1>
  <div style="display: flex; justify-content: center;">
    <input type="text" class="form-control mr-1" id="city" placeholder="City Name" style="width: 200px;">
    <input type="text" class="form-control mr-1" id="startDate" placeholder="Start Date (YYYY-MM-DD)" style="width: 210px;">
    <input type="text" class="form-control mr-1" id="endDate" placeholder="End Date (YYYY-MM-DD)" style="width: 210px;">
  </div>
</body>
The form-control class applies some preset styling to make the input field look sleek and the mr-1 class adds a slight margin to the right. The placeholder attribute adds preset text to the input field when nothing is entered in it. We also added (YYYY-MM-DD) to the placeholder because that it is the only date format that the API will accept, which we'll see later when we look at the documentation. We also made the date input fields a little longer so the placeholder text is able to fit.
Add a <button> with a label of "Graph" with attributes class="btn btn-outline-primary mr-1" onclick="getData()". The btn class adds some preset styling to make the button look sleek and the btn-outline primary class adds a color transition when you hover over the button. We'll write the getData() function later in the Javascript section.
<body>
  <h1 style="text-align: center;" class="mt-3"> Weather Grapher </h1>
  <div style="display: flex; justify-content: center;">
    <input type="text" class="form-control mr-1" id="city" placeholder="City Name" style="width: 200px;">
    <input type="text" class="form-control mr-1" id="startDate" placeholder="Start Date (YYYY-MM-DD)" style="width: 210px;">
    <input type="text" class="form-control mr-1" id="endDate" placeholder="End Date (YYYY-MM-DD)" style="width: 210px;">
    <button class="btn btn-outline-primary mr-1" onclick="getData()">Graph</button>
  </div>
</body>
We're almost done with HTML!
Add another <div> after the first <div> and also center it using justify-content. Nest another <div> inside with the styling position: relative; width: 140vh; height: 85vh; so it's big enough to hold the chart. A vh unit represents 1% of the width/height of the viewport.
Inside of this, add a <canvas> element with an id of myChart and the same width and height as its parent <div>. The canvas will hold the chart once we add it in our Javascript. We have to nest the canvas inside of a <div> for us to adjust its size. We also have to nest that inside yet another <div> for us to center it. Once we implement the chart in Javascript, feel free to play around with the size and ajust it to your liking.
At this point, the body of your HTML file should look like this:
<body>
  <h1 style="text-align: center;" class="mt-3"> Weather Grapher </h1>
  <div style="display: flex; justify-content: center;">
    <input type="text" class="form-control mr-1" id="city" placeholder="City Name" style="width: 200px;">
    <input type="text" class="form-control mr-1" id="startDate" placeholder="Start Date (YYYY-MM-DD)" style="width: 210px;">
    <input type="text" class="form-control mr-1" id="endDate" placeholder="End Date (YYYY-MM-DD)" style="width: 210px;">
    <button class="btn btn-outline-primary mr-1" onclick="getData()">Graph</button>
  </div>
  <div style="display: flex; justify-content: center;">
    <div style="width: 140vh; height: 85vh;">
      <canvas id='myChart' width='140vh' height='85vh'></canvas>
    </div>
  </div>
</body>
This is what we've built so far:
We're finally done with the HTML! It's time to tackle the JavaScript.
JavaScript
Yay! Now that we've finished writing HTML, it's time to start making it work with JavaScript.
Setting up the Chart
To get started with the Chart.js library, head on over to the documentation here. You'll see a starter template for us to use. Copy only the ctx and myChart variables. Then, navigate to the script.js file on the left side of your repl and paste those two variables in. This code creates a Chart object which we store in the variable myChart. The first argument in the constructor must be a drawing context that refers to the HTML canvas element that we want to draw to, which is the ctx variable.
Change myChart variable to be a let variable and the ctx to a const variable, since we want to avoid using var to declare variables because of ES6 conventions. The second argument in the constructor is an object with data that specifies how our chart will look like. Because we want our graph to start off empty, do the following:
- Delete all the values in the
labelsarray. - Empty the content of the
labelstring. - Empty the
dataarray since we don't have any data yet. - Delete the
backgroundColorproperty and add replace it with the propertyfill: false.- This removes any shading that would be below the line in our chart.
- Delete the array in the
borderColorproperty and replace it withborderColor: 'rgba(255, 99, 132, 1). - Add the property
borderWidth: 1so our line isn't too thick.
const ctx = document.getElementById('myChart').getContext('2d');
let myChart = new Chart(ctx, {
  type: 'line',
  data: {
  labels: [],
  datasets: [{
    label: "",
    data: [],
    fill: false,
    borderColor: 'rgba(255, 99, 132, 1)',
    borderWidth: 1
  }],
  options: {
    scales: {
      yAxes: [{
        ticks: {
          beginAtZero: true
        }
      }]
    }
  }
});
We're almost done setting up the chart!
Empty everything inside of the options object, and add the following properties (not including the options property):
options: {
  responsive: true,
  scales: {
    xAxes: [{
      ticks: {
        maxTicksLimit: 10,
      }
    }],
    yAxes: [{
      scaleLabel: {
        display: true,
        labelString: "Temperature in Celsius",
        padding: 20
      }
    }]
  }
}
Explanation: The responsive: true property allows us the chart to resize itself with respect to its parent div. We add an xAxes object with a ticks object to describe the scaling of the graph. mackTickLimits: 10 sets the maximum number of x-axis ticks as 10. For the y-axis, we add add a scaleLabel object.
We can then add the properties labelString: Temperature in Celsius and display: true which will change the y-axis label to "Temperature in Celsius" and make it visible. Lastly, we add padding: 20 which adds some space between the y-axis and its label. Customizable options like these can be found in the Chart.js documentation.
We're done setting up the chart!
Setting up the API
We'll be using the Meteostat Web API to get weather data. Before we go to the documentation, head over here to register for an API key, which we'll need when we make requests to the API. Check your email for your API key and save it to your clipboard, we'll use it later.
Here is the documentation for the API if you want to learn about it more in depth. The basic idea is that the API works by retrieving data made publicly available from various weather stations. So in order to retrieve weather data, we first have to search for weather stations in the city we're looking for, and then pick a weather station in that city to retreive data from. First, add the following variables at the very top of your JS file.
const stationURL = "https://api.meteostat.net/v2/stations/search";
const dataURL = "https://api.meteostat.net/v2/stations/daily";
stationURL is the API endpoint for retrieving various weather stations in an area. dataURL is the API endpoint for retreiving weather data from a given weather station. An API endpoint is simply a point of entry, or URL, for the client to receive a specific request from a web API. These URLs can be found in the documentation.
Retrieving a Weather Station
It's time to implement the getData() function that we applied to our "Graph" button. Note: All new code segments should be placed directly after the previous code segment unless otherwise specified. Let's start by retreiving the inputs of the city, start date, and end date. At the end of your script.js file, add:
async function getData() { // Retrieve the values of city, start date, and end date from input fields.
  const city = document.getElementById('city').value;
  const startDate = document.getElementById('startDate').value;
  const endDate = document.getElementById('endDate').value;
}
We simply retrieve the values of the inputs from the index.html file using the .getElementById() method and the .value property. We've made this an async function, which means that it will always return a promise. A promise is essentially an object returned by the function to handle a fetch() request.
For our purposes, we use it because it is always required if the await expression is used anywhere inside the function, which we'll use in a bit. We also make it an async function because then it will pause the function until a promise is returned, which we'll need when making API calls.
Read more in-depth about aync/await in JavaScript here.
Note: According to the documentation, the start and end dates for the API requests must be entered in YYYY-MM-DD format. A detailed description of the API parameters and response parameters can be found here. For the purposes of this workshop, we won't be going into input validation. However, we recommended that you try it as an exercise after completing this workshop!
We should make sure that the user inputted all the required values, like so:
if(!(city && startDate && endDate))  {
  alert('Please input all data.');
  return;
}
Our boolean expression in the if statement checks if one or more of the values from the input field are not filled out. If this is true, then we alert the user and terminate the program.
The API documentation specifies that request must contain a query parameter which contains the name of the city we're looking for. So to make our request URL, we can use the Javascript URL and URLSearchParams class to add a query property to the URL with the name of the city we're looking for:
let url = new URL(stationURL); // Create a URL object.
url.search = new URLSearchParams({ // Use URLSearchParams class to modify its query parameter.
  query: city
});
The URL constructor creates an object that allows us to easily work with the parts and components of URLs. We then modify search property of the url by using the URLSearchParams constructor to quickly add a query parameter with the value of the city we're looking for. After this, the URL would look something like: https://api.meteostat.net/v2/stations/search?query=Austin if we were to search for Austin, Texas. We are now ready to fetch data!
We can use the Javascript fetch() function to make an API request to meteostat to get back a list of weather stations in the city we're looking for:
let promise = await fetch(url, { // Make a request to find weather stations based on the city we want.
  headers: {
    "x-api-key": "(paste your API key here)" // Include API Key to authenticate the request.
  },
});
let data = await promise.json(); // Convert the response to JSON format.
The first argument in the fetch() function is always the API endpoint, or URL, if we're making an API request. The second arugment is an object with some data about the request. We have to include our API Key attatched to the x-api-key property and we have to nest this property inside the headers object, which is specified in the documentation.
The await keyword pauses the function until the promise from the API call is resolved. We then convert the response data to JSON format using the .json() method. This workshop will cover just one of many ways to use fetch().
Read more about everything that fetch() has to offer here.
If we console.log(data) with what have now, you'll see the response object with meta and data properties. The meta property contains additonal information about the API request. The data property contains a list of objects, each with a unique station ID in the area.
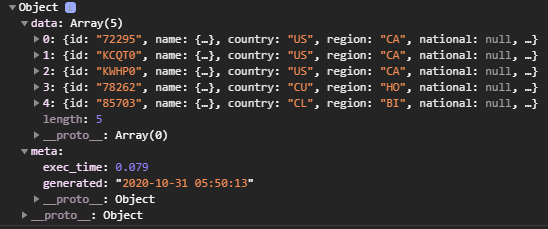
(Note: This image was taken in the console of the Chrome browser.)
If we happen to pick a weather station without any data, we should handle it with an alert message, shown below. If there is data, we'll just always pick the first weather station in the response for the sake of this workshop.
To get weather data, we have to make another API call using that specific station ID which we'll do in a retrieveData() function. However, if there's no data available, the function will return false and we'll end the program. After that, we'll use the weather data we got to update the chart in the updateChart() method.
if (!data.data) { // If no data then return the function.
  alert('No data available for the city.');
  return;
}
const stationID = data.data[0].id; // Pick the ID of the first weather station.
const graphData = await retrieveData(stationID, startDate, endDate); // Use the Station ID to get weather data.
if (!graphData) return; // If no data from first weather station then return.
updateChart(graphData, city); // Update the chart.
Retrieving Weather Data
Create a new async function named retrieveData() with parameters id, start, and end. The function will take those parameters and return an object with an array of dates for the x-axis and an array of values for the y-axis.
Inside the function, create two empty arrays named xDates and yTemps, respectively. Use the URL and URLSearchParams class to create a new request URL for a specific weather station using the URL at the top of your JS file like we did for the first request URL. The documentation requires the parameter names in the request to be named station, start, and end.
async function retrieveData(id, start, end) { // This function also has to be async because we'll be making another fetch() request.
  const xDates = [];
  const yTemps = [];

  let url = new URL(dataURL); // Remember, dataURL is the global variable we defined at the beginning of the JS file.
  url.search = new URLSearchParams({ // Add required parameters to retrieve weather data from a specific station.
    station: id,
    start: start,
    end: end
  });
}
Now we can add a fetch() request using the request URL and convert the response data to JSON format, like we did before.
let promise = await fetch(url, {
  headers: {
    "x-api-key": "(paste your API key here)" // Include API Key to authenticate the request.
  },
});
let data = await promise.json(); // Convert the response to JSON format.
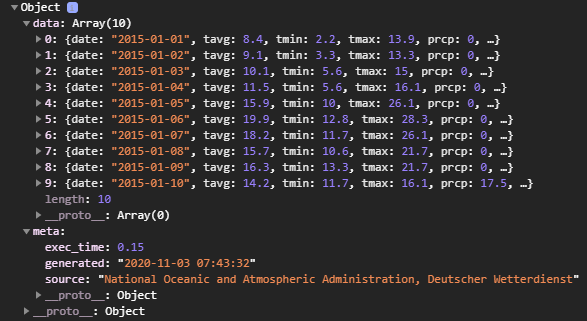
If you console.log(data), then you'll see an object with the data and meta properties, like we saw before. The data property contains an array of many objects, each object containing weather data for one specific data.
First we must check if there is data in the response, which we may not get in some weather stations. If there is, we can use a for loop to iterate through all the objects in the data property of the response object and add the date to the xDates array and the average temperatures to the yTemps array. The function will then return these variables in an object so we can graph it.
However, if the weather station that we use doesn't return any data, we'll simply alert it to the user and terminate the program for the sake of this workshop. Once you're done with this workshop, you could try to make the program loop through all the other weather stations until it gets weather data if you don't get any data from the first station.
if (data.data && data.data[0].tavg) { // Make sure that there is weather data in the API response.
  for (day of data.data) { // Iterate through the array of objects and add the average temperature and date to the xDates and yTemps array.
    xDates.push(day.date);
    yTemps.push(day.tavg);
  }
  return { xDates, yTemps };
} else { // If there's no weather data for us to use, simply alert to user and terminate the program.
  alert("No data available for this city.");
  return false;
}
Note that when we check if there is any data, we check both the data property as well as the tavg property of the first object in the data array because some weather stations may return data for other weather measurements but not tavg, so we handle that possibility as well. To iterate through the weather data, we use a "for of" loop. In the loop, day represents each object inside of the array that belongs to the data property.
Now we just have to graph this data and we're done!
Graphing the Weather Data
At the end of the script.js file, create a new function named updateChart() which takes two parameters, inputData and cityName. inputData is the data that was returned from the previous function.
Create a constant variable named newData with a label property of Average temperature in ${cityName}. We're using a template literal, which is a formatting tool that lets us easily combine strings and variable names. Anything between the backticks is a string. If a variable is needed, it can be referenced inside curly braces with a dollar sign in front.
To load the y-axis data, add a data property with a value of inputData.yTemps since the return value from our previous function returned the x-axis and y-axis data in an object. Add a fill property with a value of false so the graph is not colored in. Lastly, add the properties of borderColor: 'rgba(255, 99, 132, 1)' and borderWidth: 1 to make the lines red and thin.
function updateChart(inputData, cityName) {
  const newData = {
    label: `Average temperature in ${cityName}`,
    data: inputData.yTemps,
    fill: false,
    borderColor: 'rgba(255, 99, 132, 1)',
    borderWidth: 1
  };
}
To add this data to our graph, set the first object of the datasets property in the myChart variable equal to the newData variable. To update the x-axis, set the labels property of the myChart variable equal to inputData.xDates. Finally, call the .update() method on the myChart variable so the updates are made visible to the user.
function updateChart(inputData, cityName) {
  const newData = {
    label: `Average temperature in ${cityName}`,
      data: inputData.yTemps,
      fill: false,
      borderColor: 'rgba(255, 99, 132, 1)',
      borderWidth: 1
  };
  myChart.data.datasets[0] = newData;
  myChart.data.labels = inputData.xDates;
  myChart.update();
}
Now, if you click the green "Run" button at the top of your repl, you should see a graph!
Congratulations! You just built an awesome weather grapher project while also learning about fetch(), async/await, and the Chart.js library!
Extending the Project
Now it's your turn to apply what you know to make this project even more awesome! Feel free to use the resources linked at the bottom which provide further depth into the concepts and tools used in this workshop. Here's some inspiration on ways you can extend the project!
Multiple Datasets
In this version, you can graph the average temperature of multiple cities, not just one.
Temperature Conversion
In this version, you can convert the graph data between Fahrenheit and Celsius.
Bar Chart
In this version, you can create bar charts of the monthly average temperature by inputting a specific range of months in a given year.
Average Dataset
In this version, you can add a dataset to the graph that represents the average temperature of all the cities on the graph.
In each of these examples, including this workshop, there is not much input validation. If we enter dates that aren't in chronological order, the program won't work. As an extra exercise, you can try to implement this input validation on your own. Happy hacking!